
As a business owner, being able to track revenue by product, service, market segment, sales channel, geography, and whether revenue is coming from new or repeat customers, can provide you with valuable insight into your business performance.
This level of revenue visibility can be made possible through any entry level accounting package, like Quickbooks or Xero, provided you do some upfront planning in setting up your Chart of Accounts.
What is a Chart of Accounts anyway?
In every accounting software package, ranging from entry level small business software like QuickBooks or Xeroto larger accounting packages like Intaact or Netsuite, a classification system is needed to allocate transactions or the “Debits” and “Credits” into your accounting software – the “Chart of Accounts”. The Chart of Accounts provides the structure for how information will be stored and reported from your accounting system and will impact the quality of information that you can obtain as your company grows over the years. Do it right, and you will capture meaningful data within your accounting system for monthly reporting, do it wrong, and you will spend more time trying to compensate for the limited reporting data available in your accounting system by gathering data from other sources.
Typical Revenue Reporting for SaaS Startups
Assume that a SaaS startup generated revenues of $1 million in Year 1 and $2 million in Year 2. In some companies, revenue tracking may be limited to a few categories such as:
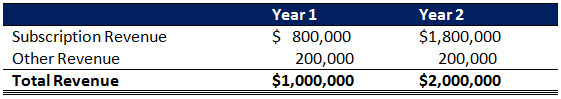
The information shows that total revenues increased from $1M to $2M or 200% year over year. Year over year change in subscription revenue was 225%, with other revenue staying flat. This level of information is highly summarized and provides very little specifics for internal management analysis. Additional revenue information must be obtained by other means and analysis.
Customizing your Chart of Accounts to Drive Greater Revenue Visibility
One of the key methods to driving greater revenue visibility, especially for a SaaS company, is to customize your Chart of Accounts. This will enable you to track and report your revenues with a higher degree of detail and streamline/automate the otherwise time consuming task of creating manual revenue reports and dashboards for your company.
By customizing your Chart of Accounts, revenue may be broken up into many more categories so that a deeper understanding and better revenue visibility can be obtained. For example, in this case, assuming sales channel, product type, new and renewal customers, and geographic segment, were key attributes we wanted to measure – we would set up a Chart of Accounts that would allow us to allocate revenue by the following attributes:
- Sales Channel
- Online Sales
- Direct Sales
- Product Type
- Subscription
- New Customers
- Renewal Customers
- Other Revenue
- Subscription
- Geographic Segment
- USA
- Canada
The level of reporting that was outlined in the Typical Revenue Reporting example above, is now greatly enhanced such that the following information could be reported directly from your accounting software.
Some additional insights from this level of revenue visibility based on this illustration:
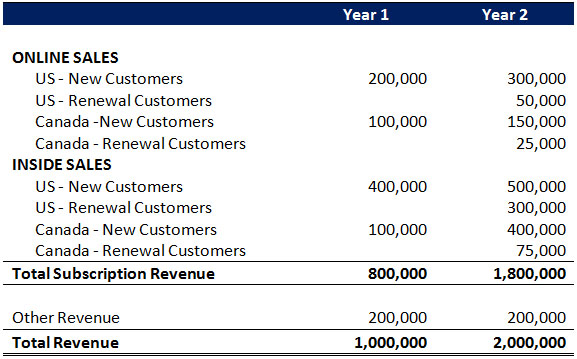
- Subscription revenue from new business grew from $800k to $1.35M
- Subscription revenue from renewal customers was $450k which based on the prior year sales of $800k represents a renewal rate of 56%. On further analysis, the data indicates that renewal rates for online sales was only 25% vs a renewal rate of 75% for inside sales which is a serious issue. This may indicate that a higher level of interaction and service with customers obtained via online credit card sales is required to ensure they are properly using the software – which may lead to higher renewal rates.
- The fastest growing segment for new sales was generated through the inside sales team targeting the Canadian market which grew year over year by 400% which may bear some further analysis to see if there are any insights to be learned and applied across the rest of the inside sales
Summary
Increasing the quality of the information available from your accounting system can be achieved by creating a customized Chart of Accounts for your business. Setting up the customized Chart of Accounts early in a Company’s lifecycle, allows the data to be captured and measured on a consistent basis month after month, year after year, providing a rich set of trended financial data to monitor the progress of the business.